Parallel Performance
Parallel Performance
Below are data from both strong (using fixed problem size) and weak (using increasingly larger problem size) scaling tests that measure the parallel performance of Athena on a variety of different machines. Since Athena is bases on an unsplit explicit update, it shows excellent scaling, even with SMR.
In these plots, efficiency is defined as the performance per core in a parallel simulations, measured in units of the performance on one core in a scalar simulation. Therefore an efficiency of one is perfect scaling.
Red Storm (Cray XT-3)
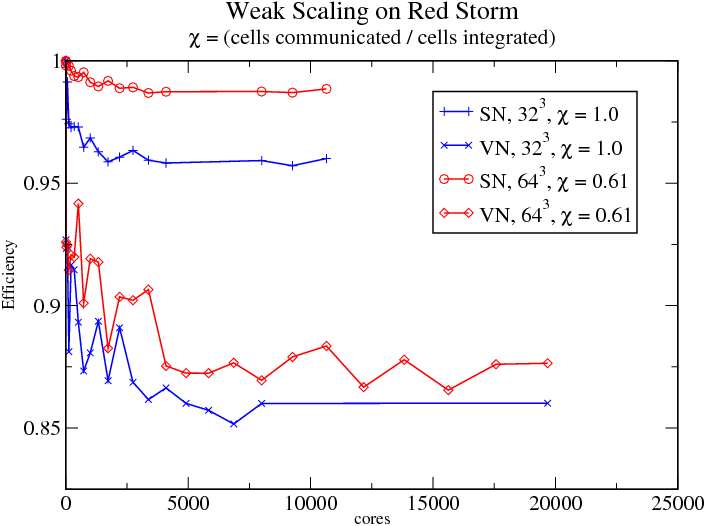
In the above figure, SN uses one core per node, VN uses two cores per node.
Kraken (Cray XT)
Kraken web site.
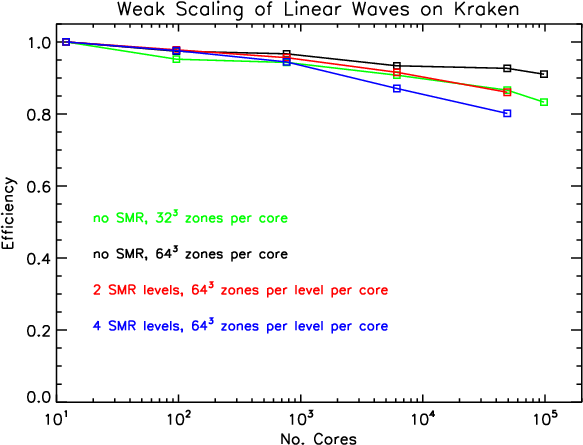
In the plot above, the black and green lines correspond to tests that use only a single (root) grid, but different numbers of cells per MPI process. The red line is a SMR calculation with one level of refinement (in addition to the root level) that covers one half of the domain. The blue line corresponds to a SMR calculation with three levels of refinement (in addition to the root level), with each refined level covering one half of its parent domain. In the SMR calculations, each MPI process updates one Grid from each level of refinement.
Note even with SMR Athena scales extremely well up to 10^5 cores.
Ranger (Linux cluster)
Ranger web site.
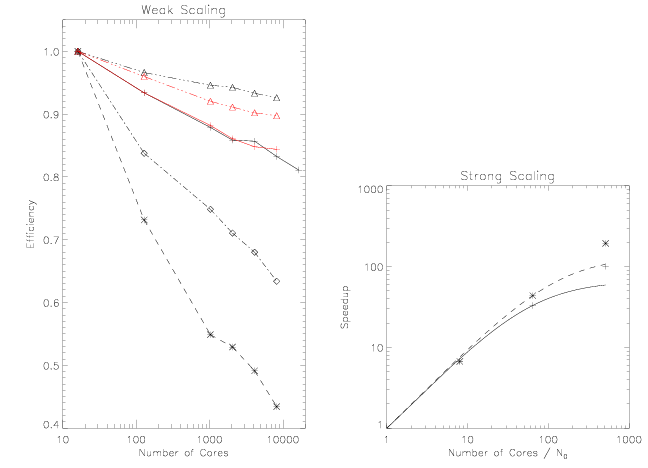
In the panel on the left above, black lines are for a single level mesh using 8^3 (X’s), 16^3 (diamonds), 32^3 (crosses), or 64^3 (triangles) cells per MPI level. The red lines are for a two-level SMR mesh, with the refined level covering one half of the root domain, and different numbers of cells per MPI core labeled as above.
In the panel on the right above, strong scaling tests are shown for two different problem sizes.