pySTEL
A Python class and utilites for interacting with the STELLOPT family of codes.
Theory
The pySTEL software contains classes for reading the inputs and outputs of the various software from STELLOPT. Additionally, it contains utility routines and GUIs for working with the inputs and outputs. The software makes use the of the Python ctypes foreign function interface. This allows calls directly to compiled code of LIBSTELL. Two dimensional visualization is provided by matplotlib while the 3D visualization is perforemd with VTK package. QT5 provides the framework for the Graphical user iterface tools.
- Utilities (call with
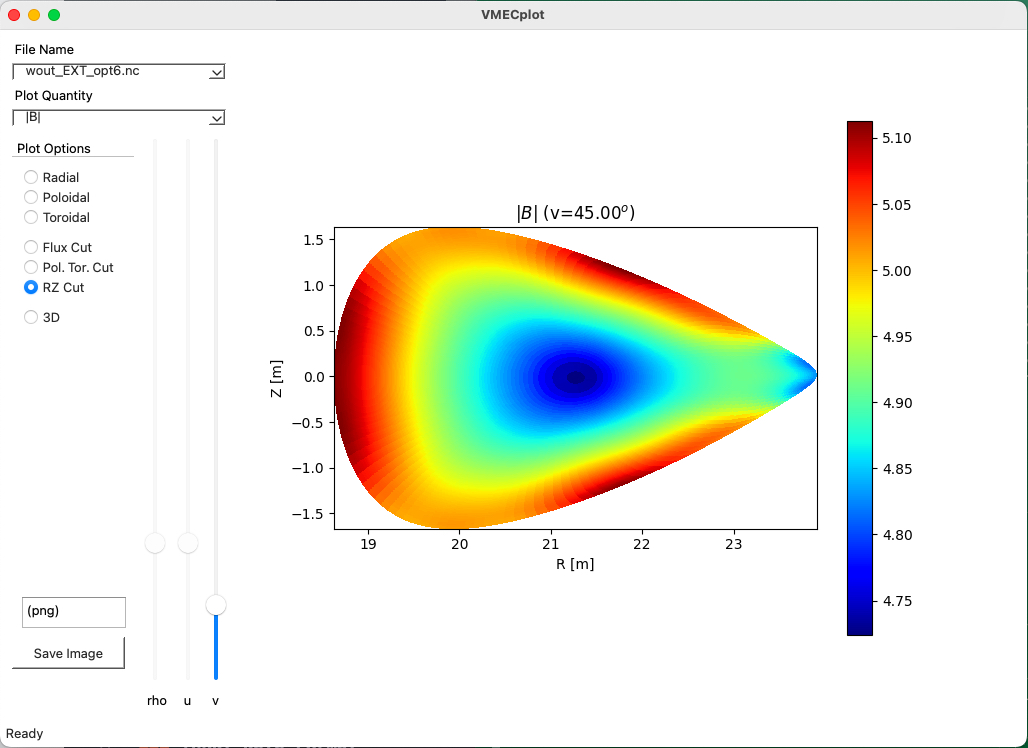
--helpfor more information)- VMECplot - A GUI for reading and plotting VMEC equilibrium
woutfiles. - STELLOPT - A GUI for plotting STELLOPT stellarator optimization output files. It includes panes for read/writing the VMEC
INDATAandOPTIMUMnamelists. - beams3d_util.py - A command line utility for plotting BEAMS3D data.
- bootsj_util.py - A command line utility for plotting BOOTSJ data.
- boozer_util.py - A command line utility for plotting BOOZ_XFORM data.
- coil_util.py - A command line utility for manipulation and plotting of coils files.
- fieldlines_util.py - A command line utility for ploting FIELDLINES data.
- focus_util.py - A command line utility for working with the FOCUS code. FOCUS is not part of STELLOPT.
- gist_util.py - A command line utility for working with GIST files.
- nescoil_util.py - A command line utility for working with NESCOIL files.
- make_mesh.py - A command line utility for 2D and 3D meshing using gmsh
- terpsichore_util.py - A command line utility for generating inputs and plotting TERPSICHORE data.
- vmec_util.py - A command line utility for working with VMEC files.
- wall_util.py - A command line utility for working with wall data.
- VMECplot - A GUI for reading and plotting VMEC equilibrium
- Helper utilities
- Classes (found in the
libstellsubdirectory)- beams3d.py - Class for BEAMS3D inputs/outputs
- bnorm.py - Class for BNORM inputs/outputs
- bootsj.py - Class for BOOTSJ inputs/outputs
- coils.py - Class for coils files.
- collisions.py - Class for plasma collisional operators.
- diagno.py - Class for DIAGNO inputs/outputs
- dkes.py - Class for DKES inputs/outputs
- fieldlines.py - Class for FIELDLINES inputs/outputs
- focus.py - Class for FOCUS inputs/outputs
- fusion.py - Class for plasma fusion cross sections.
- gist.py - Class for dealing with GIST data, generating GIST data, and calculating some turbulent transport proxies.
- libstell.py - Main class for interfacing with
LIBSTELL. - nescoil.py - Class for NESCOIL inputs/outputs
- penta.py - Class for PENTA inputs/outputs
- plot3D.py - Class for 3D plotting which wrappers VTK calls.
- popcon.py - Class for generating 0D POPCON plots.
- stellopt.py - Class for STELLOPT inputs/outputs
- terpsichore.py - Class for TERPSICHORE inputs/outputs
- thrift.py - Class for THRIFT inputs/outputs
- vmec.py - Class for VMEC inputs/outputs
- wall.py - Class for dealing with wall files.
Compilation
To compile pySTEL, from the main directory issue the command
make pystel
This builds LIBSTELL according to the instructions found on STELLOPT Compilation Page and then installs the Python components using pip and setuptools.
Please check that after building the install location is on your path.
Execution
Command line help text is provided for each code via the --help command line option. Please reference the help text for options to run each piece of software.
Calling libraries from Python
After installation the user can call the tools using the classes. For example:
    import numpy as np
    from libstell.vmec import VMEC
    from libstell.plot3D import PLOT3D
    vmec_data = VMEC()
    vmec_data.read_wout('wout_test.nc')
    plt3d = PLOT3D()
    theta = np.linspace([0],[2*np.pi],256)
    phi   = np.linspace([0],[2*np.pi],360)
    r = vmec_data.cfunct(theta,phi,vmec_data.rmnc,vmec_data.xm,vmec_data.xn)
    z = vmec_data.sfunct(theta,phi,vmec_data.zmns,vmec_data.xm,vmec_data.xn)
    b = vmec_data.cfunct(theta,phi,vmec_data.bmnc,vmec_data.xm_nyq,vmec_data.xn_nyq)
    vmec_data.isotoro(r,z,phi,[127],vals=b,plot3D=plt3d)
    rmax = np.max(r)*5
    plt3d.colorbar(title='|B| [T]')
    phi = np.deg2rad(0)
    alpha = np.deg2rad(15)
    beta = np.deg2rad(15)
    plt3d.setCamera(pos=[rmax*np.cos(phi),rmax*np.sin(phi),rmax*np.sin(alpha)],focus=[0,0,0],camup=[0,np.sin(beta),np.cos(beta)])
    plt3d.render()
    plt3d.saveImage('example.png')
Here we read VMEC data, plot it using VTK, and save the plot to a file. It should be noted that VTK saves the last state of the window so one may reposition the 3D plot as they like. When the window is closed the file is then saved.
Tutorials
See above